How to measure distance between two points using Paraview

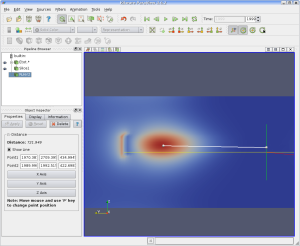
Sometimes you want to measure the distance between two points in your data using Paraview. To do that, first visualize your data using the usual way. Now to measure between two points in your data, we can use Ruler Source:

  1. Go to Menu “Sources”->”Ruler”
  2. Use your mouse to point to the first location in your data and press the “p” key in your keyboard.
  3. Use your mouse to point to the second location in your data and press “p” again. You will see the distance in the tab on the left. (See screen shot)

How to set transparency of object in Paraview

I am using paraview 3.6.2, and sometimes, it is useful to display the object and make it transparent. In this way, I can see the data and the boundary of the objects as well. To do this, load your object data, and go to tab “Display” in the “Object Inspector” window. From there, look for the section “Style”. After “Point Size” and “Line Width”, you wills see “Opacity”. Change the level opacity to make the object transparent.

Using Paraview to plot selection over time

Paraview is a nice visualization software and it is equiped with a lot of tools to analyze the data. In my current project I have a time sequence data which is stored in different VTK legacy files. The files are stored in this convention Etot.00010.vtk, Etot.00020.vtk, where the numbers are the time steps. To load the data do the following:

  1. Open paraview.
  2. Click “File->Open”
  3. Go the folder where the data files are located, you will see Etot…vtk, with a plus sign on the left. If you click the plus sign you will be able to select a particular time step data. But since we want to load all, click the upper most line, i.e. Etot…vtk.
  4. Click “Apply”.
  5. To view  cut plane, click the icon “Slice”, and click Apply.

Now, for example we are interested to plot the data over time from a particular point. To do this:

  1. Click the button “Select points on”, i.e. button with triangle and three red dots.
  2. And then choose menu “Filter->Data Analysis->Plot selection over time”. This will take some time depending on how many time steps you have. Once done. You will see another 2D plot view open up.

Problem saving image in paraview 3.6.2 “Error: GLXBadContext 154”

I installed the binary paraview 3.6.2 in Kubuntu Hardy, but whenever I wanted to save image or animation, I got this error “Error: GLXBadContext 154”, this is the screenshot of the error message and the result of the saved image:

To resolve this problem:

  1. Go to “Edit” -> “Settings”
  2. click tab “Render View”-> “General”
  3. Uncheck the option “use offscreen rendering for screenshots”.
  4. Click OK.

After I did this, I can save the image savely. This is the example of the correct image:

Saving scalar finite element data from Matlab to VTK

I found this link to save scalar and vector data from Matlab to unstructured grid in VTK legacy format:
http://people.sc.fsu.edu/~burkardt/m_src/twod_to_vtk/twod_to_vtk.html

However, I need only the scalar part, so I modified accordingly. You can download my code here:
Download

Building OpenCascade 6.3 in Kubuntu Hardy

I tried to install OpenCascade 6.3 in my Kubuntu Hardy desktop. First I downloaded the tar.gz file and untar it. After that, I go to the “ros” folder inside. There you will find the instruction in README.txt.

So the first thing I did was to edit env.csh file and change the CASROOT environtment variable to where I untarred the source code. After that I run env.csh.

The next thing was to run ./configure. This is a bit tricky since a lot of things to set up. I first installed tk8.5 by typing:

sudo apt-get install tk8.5-dev

In the first trial, the configure cannot find Xmu.h, so I installed “libxmu-headers” package. But somehow, it still cannot find my X. So what I did was to create a symbolic link to libXmu.so.6

sudo ln -s libXmu.so.6 libXmu.so

This fixed the problem and now configure can find my X. But there’s still one thing it cannot find which is java. the configure cannot find jni.h. So I installed sun-java6-jdk from apt-get and run the following configure command:

./configure --prefix=$HOME/Programs/OpenCascade/ --with-gl-include=/usr/include --with-gl-library=/usr/lib --with-xmu-include=/usr/include/X11/Xmu/ --with-xmu-library=/usr/lib/ --with-tcl=/usr/lib/tcl8.5/ --with-tk=/usr/lib/tk8.5 --with-java-include=/usr/lib/jvm/java-6-sun/include/

Now configure can find all that is required.  When I ran make, I encountered this error:

macro `AM_PROG_LIBTOOL' not found in library

From some forum, it was suggested to install libtool, so I install libtool from Adept, and the make can continue, but again it stopped and giving this error:

Makefile.am:3: directory should not contain `/'

I tried to run make again and it can continue even to the step of make install. But when I tried to run DRAWEXE application, it cannot find some library:

./DRAWEXE: error while loading shared libraries: libTKDraw.0: cannot open shared object file: No such file or directory

So I decided o try the steps described in: http://www.opencascade.org/org/forum/thread_15409/


% aclocal
% libtoolize --force
% autoconf
% automake
% mkdir build
% source flag.sh
% cd build
% ../configure ${flags}
% make
% make install

where flag.sh is defined as following:

flags="--prefix=$HOME/Programs/OpenCascade/ "
flags="$flags --with-gl-include=/usr/include --with-gl-library=/usr/lib"
flags="$flags --with-tcl=/usr/lib/tcl8.5/ --with-tk=/usr/lib/tk8.5"
flags="$flags --with-java-include=/usr/lib/jvm/java-6-sun/include/"
flags="$flags --enable-production"

I will update the post once it finishes 🙂

Matlab data save to VTK format

I was looking for some function to save matlab array to VTK data format, and found just what I wanted in this page. They are shown below with some modification on my own:

Scalar data:

function savevtk(array, filename)
%  savevtk Save a 3-D scalar array in VTK format.
%  savevtk(array, filename) saves a 3-D array of any size to
%  filename in VTK format.
    [nx, ny, nz] = size(array);
    fid = fopen(filename, 'wt');
    fprintf(fid, '# vtk DataFile Version 2.0\n');
    fprintf(fid, 'Comment goes here\n');
    fprintf(fid, 'ASCII\n');
    fprintf(fid, '\n');
    fprintf(fid, 'DATASET STRUCTURED_POINTS\n');
    fprintf(fid, 'DIMENSIONS    %d   %d   %d\n', nx, ny, nz);
    fprintf(fid, '\n');
    fprintf(fid, 'ORIGIN    0.000   0.000   0.000\n');
    fprintf(fid, 'SPACING    1.000   1.000   1.000\n');
    fprintf(fid, '\n');
    fprintf(fid, 'POINT_DATA   %d\n', nx*ny*nz);
    fprintf(fid, 'SCALARS scalars double\n');
    fprintf(fid, 'LOOKUP_TABLE default\n');
    fprintf(fid, '\n');
    for a=1:nz
        for b=1:ny
            for c=1:nx
                fprintf(fid, '%d ', array(c,b,a));
            end
            fprintf(fid, '\n');
        end
    end
    fclose(fid);
return

Vector data:

function savevtkvector(X, Y, Z, filename)
%  savevtkvector Save a 3-D vector array in VTK format
%  savevtkvector(X,Y,Z,filename) saves a 3-D vector of any size to
%  filename in VTK format. X, Y and Z should be arrays of the same
%  size, each storing speeds in the a single Cartesian directions.
    if ((size(X) ~= size(Y)) | (size(X) ~= size(Z)))
        fprint('Error: velocity arrays of unequal size\n'); return;
    end
    [nx, ny, nz] = size(X);
    fid = fopen(filename, 'wt');
    fprintf(fid, '# vtk DataFile Version 2.0\n');
    fprintf(fid, 'Comment goes here\n');
    fprintf(fid, 'ASCII\n');
    fprintf(fid, '\n');
    fprintf(fid, 'DATASET STRUCTURED_POINTS\n');
    fprintf(fid, 'DIMENSIONS    %d   %d   %d\n', nx, ny, nz);
    fprintf(fid, '\n');
    fprintf(fid, 'ORIGIN    0.000   0.000   0.000\n');
    fprintf(fid, 'SPACING    1.000   1.000   1.000\n');
    fprintf(fid, '\n');
    fprintf(fid, 'POINT_DATA   %d\n', nx*ny*nz);
    fprintf(fid, 'VECTORS vectors double\n');
    fprintf(fid, '\n');
    for a=1:nz
        for b=1:ny
            for c=1:nx
                fprintf(fid, '%f ', X(c,b,a));
                fprintf(fid, '%f ', Y(c,b,a));
                fprintf(fid, '%f ', Z(c,b,a));
            end
            fprintf(fid, '\n');
        end
    end
    fclose(fid);
return

VTK error reading ascii data! when writing using Fortran

I write a fortran code and save the data in VTK legacy format with structured points. However, for certain data somehow Paraview and Mayavi are unable to read the VTK file. It gives a “Generic Warning”, and says that
Error reading ascii data!

After days of debugging, it turns out that the cause is my precision, I used double precision for my data, and there are some data with 3 digit for the exponents, and I write to the file using ES format. This turns out cannot be read by Paraview and Mayavi. So when I changed the format to F which is just a floating point with decimal points (no exponents), then paraview and mayavi2 can read my data. But this is of course is not a good format to store. And after looking for more detail in Fortran languange, I can set my digit in the exponent to only 2. This is the format in fortran

ESw.dEe

where “e” is the digit for the exponent.

The other thing is that In VTK, I set the data type as “float”, I need to change this to “double”.

Using Plplot from fortran in Kubuntu 8.04

I installed libplplot from Kubuntu Adept package manager, and chose “libplplot-fortran9” package.

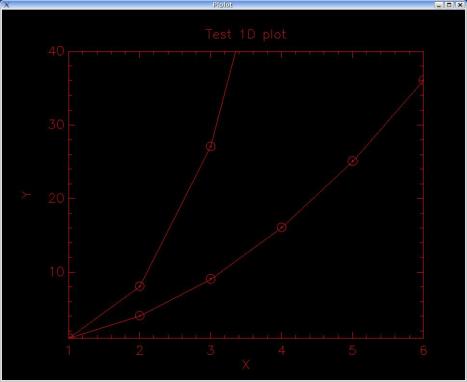
To test the code, I created the following fortran program:

program testplplot2d
use plplot
implicit none
real(plflt),dimension(6) :: x,y
real(plflt)::xmin,xmax,ymin,ymax
x=(/1,2,3,4,5,6/)
y=x**2
write(*,*) y
call plinit()
xmin=1.0
xmax=6.0
ymin=1.0
ymax=40.0
call plcol0(1)
call plenv(xmin,xmax,ymin,ymax,0,0)
call pllab('X','Y','Test 1D plot')
call plpoin(x,y,9)
call plline(x,y)
y=x**3
call plpoin(x,y,9)
call plline(x,y)
call plend()

end program testplplot2d

and then compiled it using this command:

gfortran -o simple simple.f90 `PKG_CONFIG_PATH=/usr/lib/pkgconfig pkg-config --cflags --libs plplotd-f95`

When I run ./simple, it asks me to choose the output device, and I chose “1” which is the XWin display, and it plots as shown in the image below:
simple